

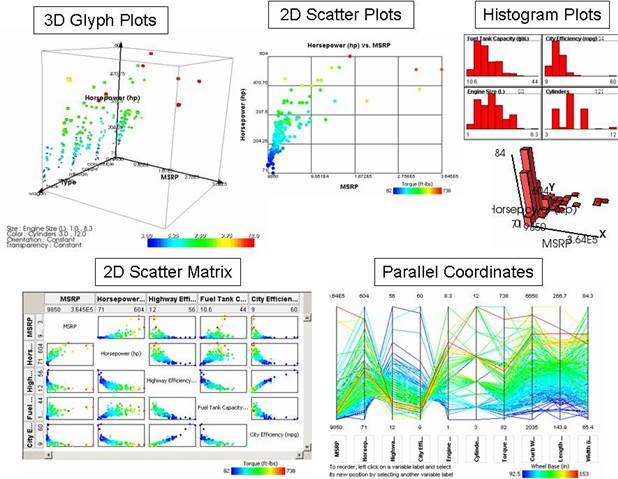
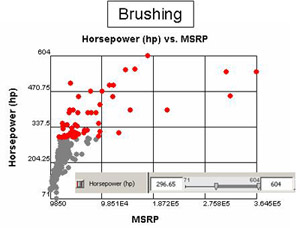
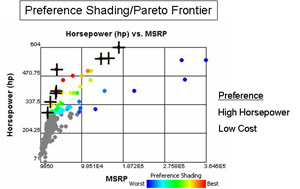
The Applied Research Laboratory's Trade Space Visualizer includes many tools to display trade space data. To support visualization of complex trade spaces, the interface includes multidimensional visualization displays such as 3D glyph plots, 2D scatter plots, 2D scatter matricies, parallel coordinates, and histogram plots. Users can dynamically filter designs using brushing tools, and use preference shading and Pareto frontiers to highlight preferred designs. Individual designs can be selected and viewed in detailed windows. Users have the ability to attach additional files to designs, such as images, 3D CAD models, or simulations.
-
Additional Features Include :
- Annotation Display
- Calculate New Columns
- Principal Component Analysis
- K-Means Cluster Analysis
- Binned Plots
- Isosurface Display in 3D Glyph Plots
- Mapping Finder for All Plots Based on Uniformity, Normallity, Skewness, ...
- Image Capture for Plots
- Prototype to Support a Group Design Environment
- 3D Stereoscopic Display of 3D Glyph Plots
- Trade Space Culling
- Documentation