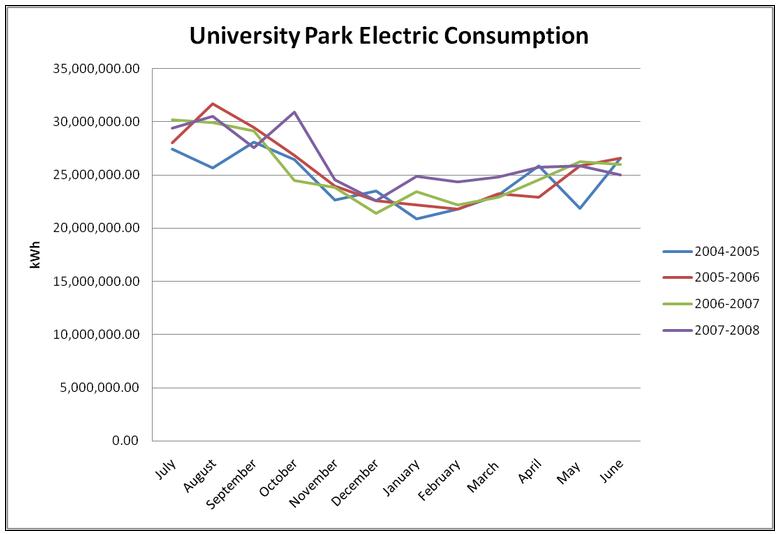
| Month | Jan | Feb | Mar | Apr | May | June | July | Aug | Sep | Oct | Nov | Dec |
|
Electrical Load (kWh) Electrical Load/Hour (kWh) |
23,000,000 31944 |
23,000,000 31944 |
24,000,000 33333 |
25,000,000 34722 |
25,000,000 34722 |
27,000,000 37500 |
30,000,000 41667 |
30,000,000 41667 |
28,000,000 38888 |
27,000,000 37500 |
23,000,000 31944 |
22,000,000 30555 |
|
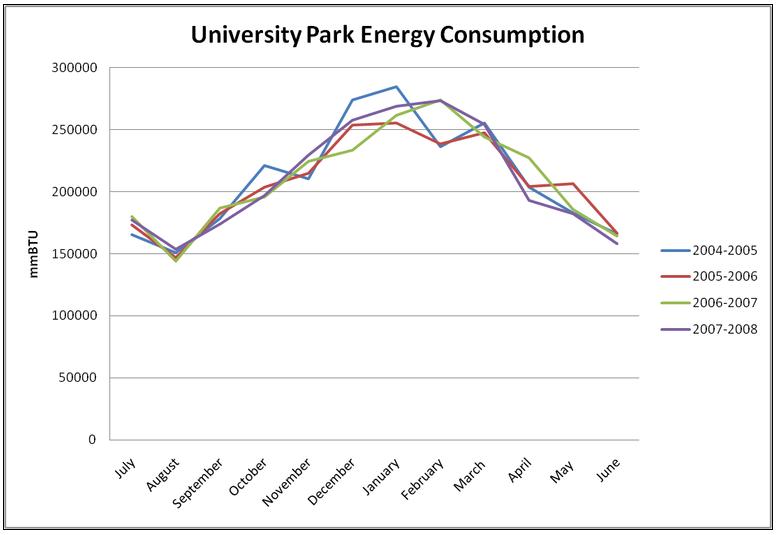
Thermal Load (kWh) Thermal Load/Hour (kWh) |
56,137,000 77968 |
53,206,000 73897 |
49,275,000 68437 |
39,482,000 54836 |
33,620,000 46694 |
22,827,000 31704 |
21,292,500 29573 |
13,965,000 19396 |
23,292,500 32351 |
31,620,000 43917 |
38,551,000 53543 |
48,344,000 67144 |
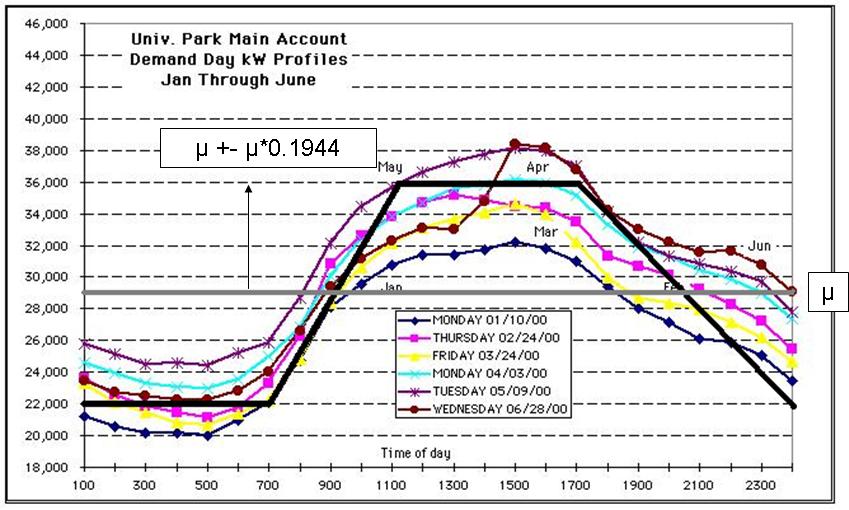
| Time (hr) | Load Equation |
| 1-7 | avg - avg*0.1944 |
| 7-11 | (avg - avg*0.1944) + (time - 7)*2*avg*0.1944/4 |
| 11-17 | avg + avg*0.1944 |
| 17-24 | (avg + avg*0.1944) - (time - 17)*2*avg*0.1944/7 |